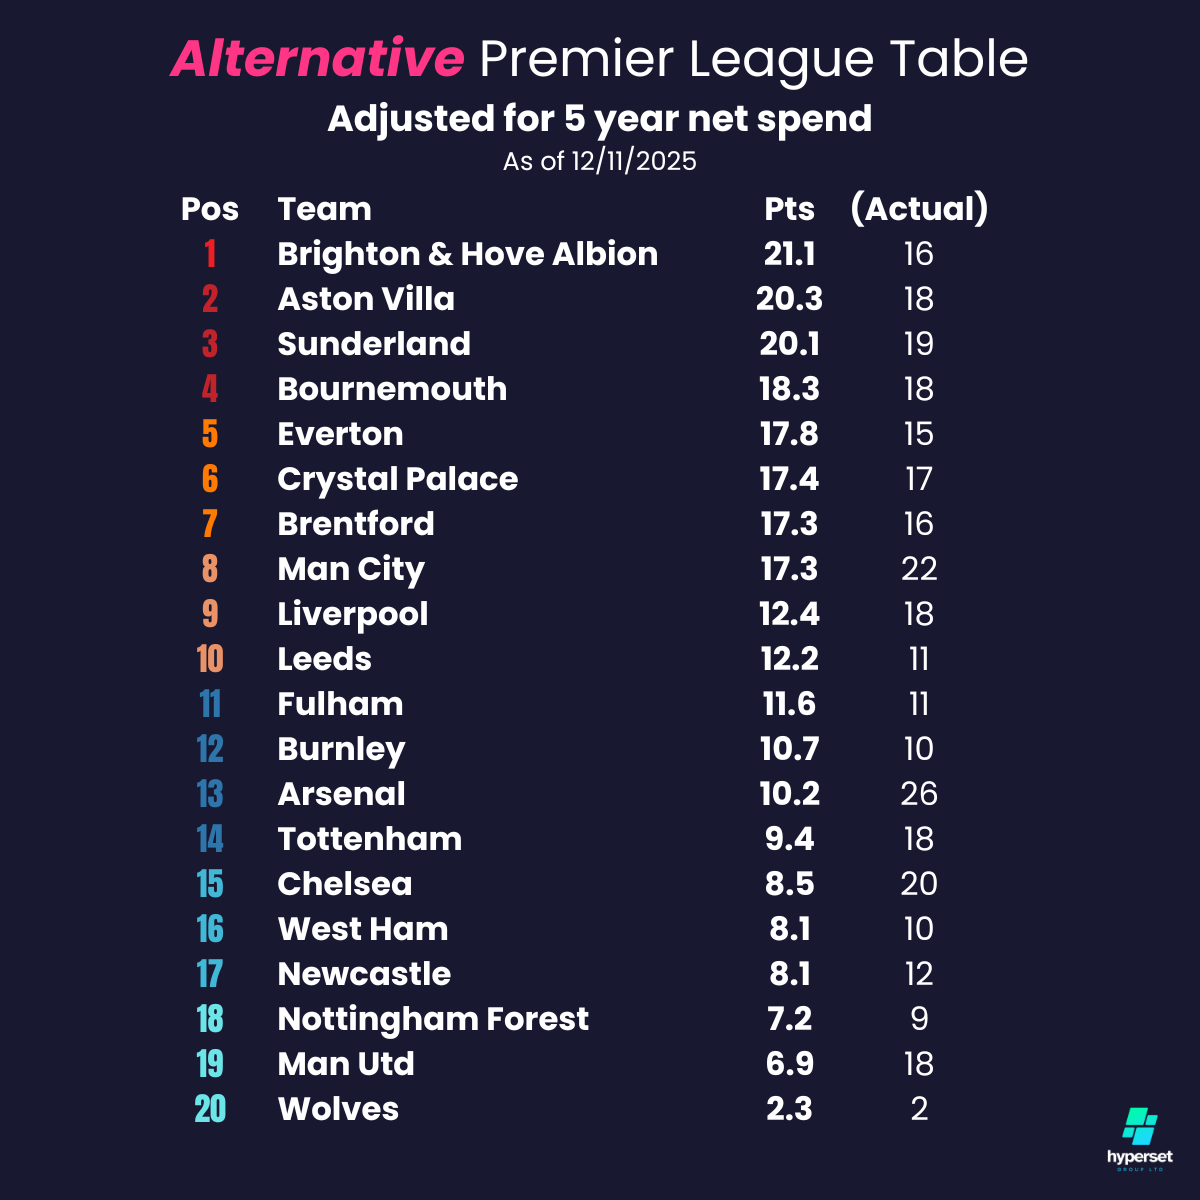
The latest 2025/2026 EPL Table: weighted for 5 year net spend
An alternative view on the current Premier League standings. This EPL table is weighted based on each team’s net spend over the last 5 years.

How do the weightings work?
The real points each team acquires in this season’s Premier League are subject to deductions, or additions, based on their net-spend total in the last 5 years.
The net spend is decimilized, subtracted from 1 and then multiplied by 1.2. So for example, Manchester United’s net spend in the last 5 years is -679,000,000 pounds (the leagues highest). This figure is translated to .679 and subtracted from 1 = 0.321. This is then multiplied by 1.2 = 0.385 (.39 when rounded to 2 decimal places). So 1 ‘real’ point for Manchester United is worth 0.39 points on the weighted table.
FAQs about the 2025/26 Weighted EPL table
Who has the largest net spend out of all EPL clubs in the last 5 years?
Manchester United have the highest net spend in the last 5 years, with a total of -679,000,000 pounds.
Who has the least net spent out of all the EPL clubs in the last 5 years?
Brighton and Hove Albion. They are the only 2025/26 Premier League club to show a postive net spend of 10,100,000 after a host of lucrative player sales in that time.
Is this weighted table an accurate reflection of the effect net spend has on the EPL??
To an extent. This table could be created in many different ways (and with more mathmatical rigour). However, it provides some fun (hopefully) and a decent signal as to how a club is really performing based on the amount of money they spend and the ‘actual’ points they are accumalating in the EPL.
How come some teams spend so much more than others?
This comes back to how much money a team is able to generate. Financial Fair Play (FFP) is based off a teams profit and loss, rather than ‘just’ what they spend. TV money is integral to this, as are tickets sales, sponsorships and merchandise – all of which is becoming ever more global. A team like Manchester United with a huge fan base is able to capatalise on these factors compared to other ‘smaller’ teams.
How often is the table updated?
The table is updated every EPL match week.
Please view on LinkedIn (below) and follow for our latest audience insights on the sport and media industry. For more information, Football Insider have also run a story on our creation of the net-spend weighted EPL table.
To enquire further please contact stefan@hypersetgroup.com