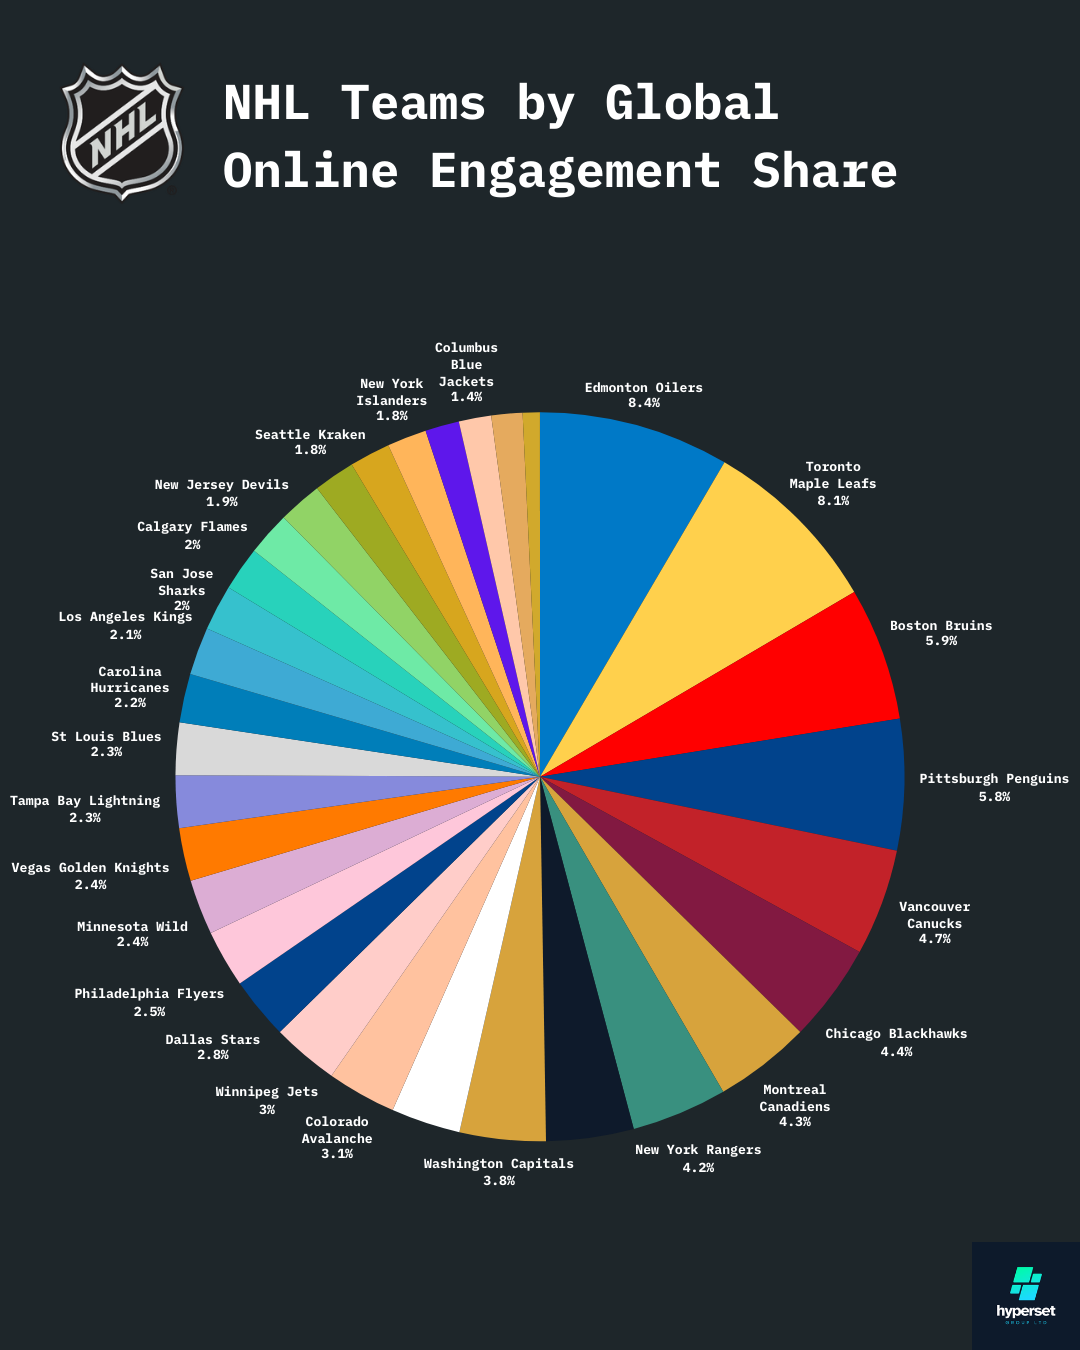
Which NHL team has the most fans?
Edmonton Oilers, Minnesota Wild and Toronto Maple Leafs are currently tied for the highest measured worldwide NHL search demand, at approximately 1.83 million monthly searches each in September 2026. Hyperset compares all 32 franchises using global and US search demand, recent geographic interest, YouTube search behaviour and broader historical digital-engagement signals.
What is changing in NHL interest right now?
Short-window relative search interest compared with last 30 days. This is the live layer of the dataset: current ranking differences rather than a claim that every change occurred after a specific date.
Washington Capitals jumps 18 places in Illinois
Washington Capitals is #5 over the last 7 days, versus #23 over the last 30 days.
Ottawa Senators jumps 17 places in Texas
Ottawa Senators is #7 over the last 7 days, versus #24 over the last 30 days.
Ottawa Senators jumps 16 places in Michigan
Ottawa Senators is #5 over the last 7 days, versus #21 over the last 30 days.
Calgary Flames jumps 17 places in Massachusetts
Calgary Flames is #9 over the last 7 days, versus #26 over the last 30 days.
Calgary Flames jumps 15 places in Missouri
Calgary Flames is #3 over the last 7 days, versus #18 over the last 30 days.
Edmonton Oilers jumps 12 places in Virginia
Edmonton Oilers is #5 over the last 7 days, versus #17 over the last 30 days.
Winnipeg Jets jumps 11 places in Pennsylvania
Winnipeg Jets is #6 over the last 7 days, versus #17 over the last 30 days.
Detroit Red Wings jumps 10 places in Colorado
Detroit Red Wings is #7 over the last 7 days, versus #17 over the last 30 days.
Most Searched NHL Teams Worldwide
September 2026 monthly search demand, with year-on-year change and rank movement versus September 2025.
| Rank | Team | Current demand | YoY change | YoY rank Δ |
|---|---|---|---|---|
| #1 | Edmonton Oilers | 1.8M | +122.4% | ▲1 |
| #1 | Minnesota Wild | 1.8M | +306.7% | ▲3 |
| #1 | Toronto Maple Leafs | 1.8M | +50.0% | — |
| #2 | Buffalo Sabres | 1.5M | +509.8% | ▲5 |
| #2 | Colorado Avalanche | 1.5M | +509.8% | ▲5 |
| #3 | Boston Bruins | 1.2M | +231.5% | ▲2 |
| #3 | Carolina Hurricanes | 1.2M | +395.9% | ▲4 |
| #3 | Detroit Red Wings | 1.2M | +171.1% | ▲1 |
| #3 | Pittsburgh Penguins | 1.2M | +121.8% | — |
| #4 | Dallas Stars | 1.0M | +232.2% | ▲2 |
| #4 | Vegas Golden Knights | 1.0M | +506.1% | ▲5 |
| #5 | Tampa Bay Lightning | 823.0K | +309.5% | ▲3 |
| #5 | Vancouver Canucks | 823.0K | +82.9% | ▼1 |
| #6 | Anaheim Ducks | 673.0K | +307.9% | ▲3 |
| #6 | Florida Panthers | 673.0K | +123.6% | — |
| #6 | Ottawa Senators | 673.0K | +173.6% | ▲1 |
| #6 | San Jose Sharks | 673.0K | +234.8% | ▲2 |
| #6 | Winnipeg Jets | 673.0K | +82.9% | ▼1 |
| #7 | Chicago Blackhawks | 550.0K | +82.7% | ▼1 |
| #7 | Los Angeles Kings | 550.0K | +233.3% | ▲2 |
| #7 | Philadelphia Flyers | 550.0K | +233.3% | ▲2 |
| #7 | Utah Mammoth | 550.0K | +123.6% | — |
| #8 | Calgary Flames | 450.0K | +49.5% | ▼2 |
| #8 | New York Islanders | 450.0K | +123.9% | — |
| #8 | New York Rangers | 450.0K | +82.9% | ▼1 |
| #8 | St Louis Blues | 450.0K | +123.9% | — |
| #9 | Seattle Kraken | 368.0K | +123.0% | — |
| #9 | Washington Capitals | 368.0K | +123.0% | — |
| #10 | Columbus Blue Jackets | 301.0K | +173.6% | ▲1 |
| #10 | Nashville Predators | 301.0K | +123.0% | — |
| #10 | New Jersey Devils | 301.0K | +123.0% | — |
| — | Montreal Canadiens | — | — | — |
Which NHL teams are searched most worldwide?
The latest September 2026 global search-volume layer has Edmonton, Minnesota and Toronto tied at the top. All 32 NHL teams are shown below. Montreal Canadiens is included but marked without a current figure because its latest search-volume match returned no reliable value.
Which NHL team leads search interest in each US state?
The leading NHL team in every measured US state over the latest 30-day comparison window. Hover or tap a state to see the leader and runner-up.
View all state leaders
| State | Leading team | Runner-up |
|---|---|---|
| Alabama | Edmonton Oilers | Anaheim Ducks |
| Alaska | Edmonton Oilers | Anaheim Ducks |
| Arizona | Edmonton Oilers | Anaheim Ducks |
| Arkansas | Edmonton Oilers | Anaheim Ducks |
| California | Edmonton Oilers | Anaheim Ducks |
| Colorado | Colorado Avalanche | Anaheim Ducks |
| Connecticut | Boston Bruins | San Jose Sharks |
| Delaware | Edmonton Oilers | Anaheim Ducks |
| Florida | Florida Panthers | Tampa Bay Lightning |
| Georgia | Edmonton Oilers | Anaheim Ducks |
| Hawaii | Seattle Kraken | Edmonton Oilers |
| Idaho | Chicago Blackhawks | Edmonton Oilers |
| Illinois | Chicago Blackhawks | St Louis Blues |
| Indiana | Florida Panthers | New Jersey Devils |
| Iowa | Colorado Avalanche | Carolina Hurricanes |
| Kansas | Winnipeg Jets | Minnesota Wild |
| Kentucky | Edmonton Oilers | Anaheim Ducks |
| Louisiana | St Louis Blues | Ottawa Senators |
| Maine | Edmonton Oilers | Anaheim Ducks |
| Maryland | Washington Capitals | Dallas Stars |
| Massachusetts | Boston Bruins | San Jose Sharks |
| Michigan | Detroit Red Wings | Pittsburgh Penguins |
| Minnesota | Minnesota Wild | Florida Panthers |
| Mississippi | Edmonton Oilers | Anaheim Ducks |
| Missouri | St Louis Blues | San Jose Sharks |
| Montana | Edmonton Oilers | Anaheim Ducks |
| Nebraska | Edmonton Oilers | Anaheim Ducks |
| Nevada | Vegas Golden Knights | Utah Mammoth |
| New Hampshire | Edmonton Oilers | Anaheim Ducks |
| New Jersey | San Jose Sharks | New Jersey Devils |
| New Mexico | Edmonton Oilers | Anaheim Ducks |
| New York | Buffalo Sabres | New York Rangers |
| North Carolina | Carolina Hurricanes | Dallas Stars |
| North Dakota | Edmonton Oilers | Anaheim Ducks |
| Ohio | Columbus Blue Jackets | Dallas Stars |
| Oklahoma | Edmonton Oilers | Anaheim Ducks |
| Oregon | Utah Mammoth | Boston Bruins |
| Pennsylvania | Pittsburgh Penguins | Philadelphia Flyers |
| Rhode Island | Edmonton Oilers | Anaheim Ducks |
| South Carolina | Edmonton Oilers | Anaheim Ducks |
| South Dakota | Edmonton Oilers | Anaheim Ducks |
| Tennessee | Edmonton Oilers | Anaheim Ducks |
| Texas | Dallas Stars | Florida Panthers |
| Utah | Edmonton Oilers | Anaheim Ducks |
| Vermont | Edmonton Oilers | Anaheim Ducks |
| Virginia | Boston Bruins | San Jose Sharks |
| Washington | Edmonton Oilers | Anaheim Ducks |
| West Virginia | Florida Panthers | Toronto Maple Leafs |
| Wisconsin | Chicago Blackhawks | St Louis Blues |
| Wyoming | Nashville Predators | New York Rangers |
Where is NHL team search interest strongest in the US?
A combined relative interest index built from all 32 NHL franchises over the latest 30-day window. The highest-interest state is indexed to 100.
View state-level NHL interest
| State | Relative NHL interest |
|---|---|
| Wyoming | 100.0 |
| Maine | 75.1 |
| North Carolina | 71.8 |
| Colorado | 69.3 |
| Missouri | 66.4 |
| Utah | 61.2 |
| Kansas | 58.9 |
| Iowa | 53.7 |
| New Hampshire | 51.5 |
| Massachusetts | 49.0 |
| Connecticut | 46.4 |
| Nevada | 46.3 |
| Oregon | 46.3 |
| South Carolina | 44.7 |
| Michigan | 43.1 |
| Florida | 42.9 |
| Texas | 42.8 |
| Minnesota | 40.7 |
| Wisconsin | 40.5 |
| Louisiana | 38.9 |
| Illinois | 38.8 |
| Hawaii | 38.6 |
| Indiana | 37.2 |
| Nebraska | 36.5 |
| South Dakota | 35.7 |
| Alaska | 34.3 |
| Pennsylvania | 34.0 |
| Arizona | 33.8 |
| New York | 33.0 |
| Maryland | 32.9 |
| New Jersey | 32.6 |
| Ohio | 31.4 |
| Washington | 31.1 |
| Virginia | 30.8 |
| Delaware | 29.9 |
| Alabama | 25.3 |
| California | 23.3 |
| Tennessee | 23.0 |
| Idaho | 22.7 |
| Georgia | 21.6 |
| Vermont | 20.8 |
| Oklahoma | 20.7 |
| Rhode Island | 20.4 |
| North Dakota | 19.7 |
| Kentucky | 18.7 |
| Mississippi | 16.4 |
| New Mexico | 13.9 |
| West Virginia | 10.9 |
| Arkansas | 5.8 |
| Montana | 0.0 |
How concentrated is NHL search demand?
Share of measured worldwide NHL search demand
All 31 teams with reliable September 2026 values are shown individually. Slice colours use each team's primary brand colour; external labels show team abbreviation and share.
Which NHL teams have the strongest audience outside the US?
US demand vs rest-of-world demand
Each point represents one NHL team using September 2026 monthly search demand. Rest-of-world demand is calculated as worldwide demand minus US demand. All measured teams are labelled with standard abbreviations; hover a point for the full team name and values.
Which NHL teams are strongest in YouTube Search?
The latest US YouTube Search comparison is a relative interest index rather than an absolute search count. San Jose Sharks currently leads the measured comparison, followed by Carolina Hurricanes and Boston Bruins.
How did the broader NHL digital ecosystem compare in February 2026?
The legacy Hyperset index combined search, website traffic and social-platform audience signals. It is a broader engagement measure, not the same metric as current monthly search demand.
Which NHL teams attracted the most site traffic in the legacy dataset?
The February 2026 analysis placed Edmonton first at approximately 865.8K monthly site visits, Toronto second at around 722K and Washington third at around 612.3K. This is retained as dated historical context until the current structured NHL domain-traffic layer is complete.
Explore all 32 NHL teams
Existing Hyperset NHL team URLs are preserved.
How the NHL audience data is measured
Current search-demand figures are estimates for searches of full team names and are not fan counts. Geographic movement compares relative search-interest rankings across the latest 7-day and 30-day windows; it does not claim a change occurred on a specific day. Historical February 2026 digital-index figures combine multiple digital-audience signals and are shown separately so they are not confused with current search demand.